
|
|
Boost : |
From: Paul A Bristow (pbristow_at_[hidden])
Date: 2007-01-08 12:08:50
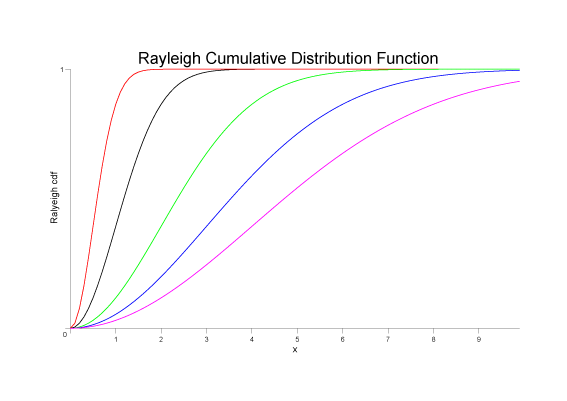
In producing documentation for John Maddock's Math Toolkit, we have used a C++ program to output csv files, with titles in row 1,
and data points below, usually several columns, to produce .
We then imported this into RJS Graph (version 3.90.10), did a lot of fiddling each time to set the axes, labels, colours, point
sizes etc, and finally exported a .ps file.
Finally (phew!) we opened with Adobe Photoshop, changed size and saved as .png files (sample attached).
These were then referenced from Boost Quickbook to make them appear in the html and pdf.
There has got to be a better way!!!
Do Boosters have any suggestions/experience on how to automate this process, ideally so that a C++ program directly outputs a .png
file.
Thanks
Paul
---
Paul A Bristow
Prizet Farmhouse, Kendal, Cumbria UK LA8 8AB
+44 1539561830 & SMS, Mobile +44 7714 330204 & SMS
pbristow_at_[hidden]
Boost list run by bdawes at acm.org, gregod at cs.rpi.edu, cpdaniel at pacbell.net, john at johnmaddock.co.uk