
|
|
Boost Users : |
Subject: Re: [Boost-users] [boost][stacktrace] stacktrace keep eating memory
From: Nat Goodspeed (nat_at_[hidden])
Date: 2019-03-29 19:22:14
On Wed, Mar 20, 2019 at 6:05 AM Hao Jiang via Boost-users <
boost-users_at_[hidden]> wrote:
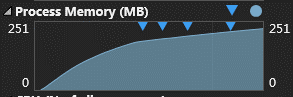
I am using stacktrace on Windows. I found stacktrace keep eating my memory.
> A simple test program:
>
>
>
> *void foo() {*
>
> * auto st = boost::stacktrace::stacktrace{};*
>
> * auto line = st.begin()->source_line();*
>
> * std::cout << line << std::endl;*
>
> *}*
>
> *void main() {*
>
> * for (int i = 0; i < 0xFFFF; i++) {*
>
> * foo();*
>
> * }*
>
> *}*
>
Presumably the source_line() call asks the library to resolve the symbolic
stacktrace information, rather than simply capturing it as in the
stacktrace constructor.
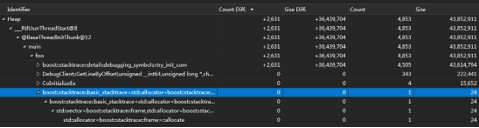
Am I reading that screenshot correctly that the size of the leak is 24
bytes per symbolic resolution? The image is a little small.
How hard would it be to identify the operation that causes the allocation
in question? I'm curious whether it's simply a dropped pointer in the
stacktrace library, or something owned by the underlying platform
operations.
I suspect you're driving an unusual / unanticipated use case. I believe the
typical assumption is that although a given process might instantiate
stacktrace() a large number of times, it won't perform symbolic resolution
more than a few times. I believe the library documentation emphasizes that
symbolic stacktrace resolution is potentially high-overhead.
Boost-users list run by williamkempf at hotmail.com, kalb at libertysoft.com, bjorn.karlsson at readsoft.com, gregod at cs.rpi.edu, wekempf at cox.net