
|
|
Boost : |
Subject: Re: [boost] [all][testing] Regression summary upgrades
From: Adam Wulkiewicz (adam.wulkiewicz_at_[hidden])
Date: 2015-05-14 11:31:55
Rene Rivera wrote:
> b. Use a regular shape, like a circle or square, that varies in size to
> show the percentage. This eliminates the bias entirely. Unfortunately the
> easiest way to do this one is with embedded SVGs. But it is possible,
> although hard, to do it with plain html+css. For an example of what this
> type of chart looks like take a look at the github puch card graph <
> https://github.com/boostorg/build/graphs/punch-card>.
>
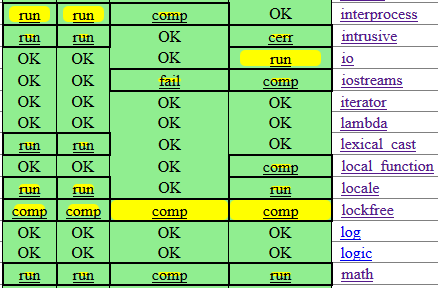
That's a good idea. AFAIU it even doesn't need to be a regular shape. It
could as well be a rectangle or an ellipse. For instance:
https://raw.githubusercontent.com/awulkiew/data-images/master/summary-percent-graphical-rect.png
or
https://raw.githubusercontent.com/awulkiew/data-images/master/summary-percent-graphical-rect-round.png
https://raw.githubusercontent.com/awulkiew/data-images/master/summary-percent-graphical-ellipse.png
it the browser supported CSS3 rounded corners. On older browsers user
should see a rectangle.
Regards,
Adam
Boost list run by bdawes at acm.org, gregod at cs.rpi.edu, cpdaniel at pacbell.net, john at johnmaddock.co.uk