
|
|
Boost : |
Subject: Re: [boost] [all][testing] Regression summary upgrades
From: Rene Rivera (grafikrobot_at_[hidden])
Date: 2015-05-14 10:21:40
On Thu, May 14, 2015 at 8:54 AM, Adam Wulkiewicz <adam.wulkiewicz_at_[hidden]>
wrote:
>
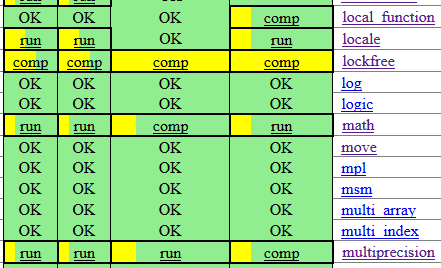
> Btw, this is how it could look like if the bar was horizontal:
>
> https://raw.githubusercontent.com/awulkiew/data-images/master/summary-percent-graphical-h.png
>
I was about to suggest horizontal before I got to this :-)
Does someone have an entirely different idea?
>
I have two ideas.. Both of which I've experimented with in a cloud based
regression reporting system I've worked on over the years (in my not
copious spare time):
a. Used a fixed sized icon that fills (either horizontal or vertical).
Making it fixed sized reduces the weight toward either user vs. developer
(but doesn't eliminate it completely).
b. Use a regular shape, like a circle or square, that varies in size to
show the percentage. This eliminates the bias entirely. Unfortunately the
easiest way to do this one is with embedded SVGs. But it is possible,
although hard, to do it with plain html+css. For an example of what this
type of chart looks like take a look at the github puch card graph <
https://github.com/boostorg/build/graphs/punch-card>.
HTH.
--
-- Rene Rivera
-- Grafik - Don't Assume Anything
-- Robot Dreams - http://robot-dreams.net
-- rrivera/acm.org (msn) - grafikrobot/aim,yahoo,skype,efnet,gmail
Boost list run by bdawes at acm.org, gregod at cs.rpi.edu, cpdaniel at pacbell.net, john at johnmaddock.co.uk