
|
|
Boost : |
Subject: Re: [boost] [all][testing] Regression summary upgrades
From: Rene Rivera (grafikrobot_at_[hidden])
Date: 2015-05-14 16:38:21
On Thu, May 14, 2015 at 3:31 PM, Adam Wulkiewicz <adam.wulkiewicz_at_[hidden]>
wrote:
> Rene Rivera wrote:
>
>> On Thu, May 14, 2015 at 10:31 AM, Adam Wulkiewicz <
>> adam.wulkiewicz_at_[hidden]
>>
>>> wrote:
>>> Rene Rivera wrote:
>>>
>>> b. Use a regular shape, like a circle or square, that varies in size to
>>>> show the percentage. This eliminates the bias entirely. Unfortunately
>>>> the
>>>> easiest way to do this one is with embedded SVGs. But it is possible,
>>>> although hard, to do it with plain html+css. For an example of what this
>>>> type of chart looks like take a look at the github puch card graph <
>>>> https://github.com/boostorg/build/graphs/punch-card>.
>>>>
>>>>
>>>> That's a good idea. AFAIU it even doesn't need to be a regular shape.
>>> It
>>> could as well be a rectangle or an ellipse. For instance:
>>>
>>>
>>> https://raw.githubusercontent.com/awulkiew/data-images/master/summary-percent-graphical-rect.png
>>> or
>>>
>>>
>>> https://raw.githubusercontent.com/awulkiew/data-images/master/summary-percent-graphical-rect-round.png
>>>
>>>
>>> https://raw.githubusercontent.com/awulkiew/data-images/master/summary-percent-graphical-ellipse.png
>>> it the browser supported CSS3 rounded corners. On older browsers user
>>> should see a rectangle.
>>>
>>
>> Two things..
>>
>> It's definitely going to look more pleasing, more natural, and hence
>> easier
>> to understand if it's a regular shape. The human brain is biased to that
>> kind of understanding.
>>
>> You can't map the percentage linearly to the size of the shape. You need
>> to
>> map it to the surface area of the shape. I know this makes it slightly
>> harder.. But hey it's humans we are targeting, and they are nasty to deal
>> with ;-)
>>
>
>
> https://raw.githubusercontent.com/awulkiew/data-images/master/summary-percent-graphical-disk.png
>
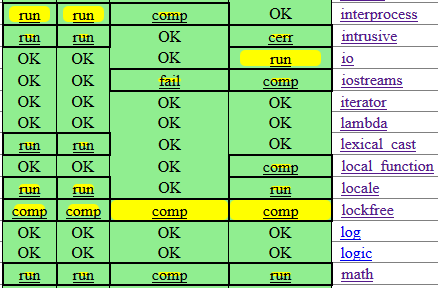
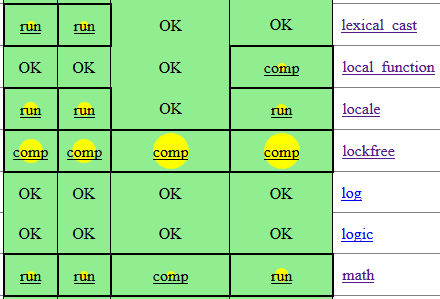
> Even when the shapes are disks it doesn't look right, because there is a
> lot of green around them, the cells are rectangular. It would probably be
> ok if the cells were squares but it'd require getting rid of the runners
> and toolsets names as they're now. I wanted to avoid major changes.
> Furthermore I'm not sure if that'd be really required. As I see it, for
> non-regular cells what is important is the relation of a yellow (failure)
> area and a green (pass) area in a cell. In other words how much is the cell
> filled with "failures". I don't think it's ideal since I agree that the
> regression matrix in general could have more modern look. But I think that
> for now it'd be good enough.
Yeah, in the current limited arrangement it's not a good choice. Without of
course, changing the arrangement to separate out the percent indicator. I'd
say go with the plain horizontal bar. And think about it more later if you
really want to.
--
-- Rene Rivera
-- Grafik - Don't Assume Anything
-- Robot Dreams - http://robot-dreams.net
-- rrivera/acm.org (msn) - grafikrobot/aim,yahoo,skype,efnet,gmail
Boost list run by bdawes at acm.org, gregod at cs.rpi.edu, cpdaniel at pacbell.net, john at johnmaddock.co.uk