
|
|
Boost : |
Subject: Re: [boost] [all][testing] Regression summary upgrades
From: Rene Rivera (grafikrobot_at_[hidden])
Date: 2015-05-14 16:39:04
On Thu, May 14, 2015 at 3:38 PM, Rene Rivera <grafikrobot_at_[hidden]> wrote:
>
>
> On Thu, May 14, 2015 at 3:31 PM, Adam Wulkiewicz <
> adam.wulkiewicz_at_[hidden]> wrote:
>
>> Rene Rivera wrote:
>>
>>> On Thu, May 14, 2015 at 10:31 AM, Adam Wulkiewicz <
>>> adam.wulkiewicz_at_[hidden]
>>>
>>>> wrote:
>>>> Rene Rivera wrote:
>>>>
>>>> b. Use a regular shape, like a circle or square, that varies in size to
>>>>> show the percentage. This eliminates the bias entirely. Unfortunately
>>>>> the
>>>>> easiest way to do this one is with embedded SVGs. But it is possible,
>>>>> although hard, to do it with plain html+css. For an example of what
>>>>> this
>>>>> type of chart looks like take a look at the github puch card graph <
>>>>> https://github.com/boostorg/build/graphs/punch-card>.
>>>>>
>>>>>
>>>>> That's a good idea. AFAIU it even doesn't need to be a regular shape.
>>>> It
>>>> could as well be a rectangle or an ellipse. For instance:
>>>>
>>>>
>>>> https://raw.githubusercontent.com/awulkiew/data-images/master/summary-percent-graphical-rect.png
>>>> or
>>>>
>>>>
>>>> https://raw.githubusercontent.com/awulkiew/data-images/master/summary-percent-graphical-rect-round.png
>>>>
>>>>
>>>> https://raw.githubusercontent.com/awulkiew/data-images/master/summary-percent-graphical-ellipse.png
>>>> it the browser supported CSS3 rounded corners. On older browsers user
>>>> should see a rectangle.
>>>>
>>>
>>> Two things..
>>>
>>> It's definitely going to look more pleasing, more natural, and hence
>>> easier
>>> to understand if it's a regular shape. The human brain is biased to that
>>> kind of understanding.
>>>
>>> You can't map the percentage linearly to the size of the shape. You need
>>> to
>>> map it to the surface area of the shape. I know this makes it slightly
>>> harder.. But hey it's humans we are targeting, and they are nasty to deal
>>> with ;-)
>>>
>>
>>
>> https://raw.githubusercontent.com/awulkiew/data-images/master/summary-percent-graphical-disk.png
>>
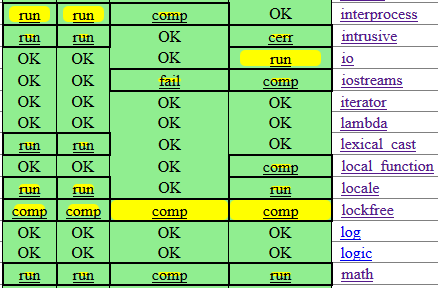
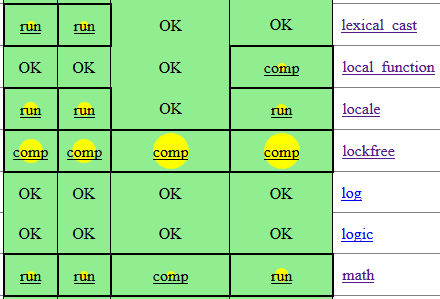
>> Even when the shapes are disks it doesn't look right, because there is a
>> lot of green around them, the cells are rectangular. It would probably be
>> ok if the cells were squares but it'd require getting rid of the runners
>> and toolsets names as they're now. I wanted to avoid major changes.
>> Furthermore I'm not sure if that'd be really required. As I see it, for
>> non-regular cells what is important is the relation of a yellow (failure)
>> area and a green (pass) area in a cell. In other words how much is the cell
>> filled with "failures". I don't think it's ideal since I agree that the
>> regression matrix in general could have more modern look. But I think that
>> for now it'd be good enough.
>
>
> Yeah, in the current limited arrangement it's not a good choice. Without
> of course, changing the arrangement to separate out the percent indicator.
> I'd say go with the plain horizontal bar. And think about it more later if
> you really want to.
>
PS. Thanks for giving it a try for my sake :-)
--
-- Rene Rivera
-- Grafik - Don't Assume Anything
-- Robot Dreams - http://robot-dreams.net
-- rrivera/acm.org (msn) - grafikrobot/aim,yahoo,skype,efnet,gmail
Boost list run by bdawes at acm.org, gregod at cs.rpi.edu, cpdaniel at pacbell.net, john at johnmaddock.co.uk