
|
|
Boost : |
Subject: Re: [boost] [all][testing] Regression summary upgrades
From: Adam Wulkiewicz (adam.wulkiewicz_at_[hidden])
Date: 2015-05-14 09:54:37
Tom Kent wrote:
> On Wed, May 13, 2015 at 8:42 PM, Adam Wulkiewicz <adam.wulkiewicz_at_[hidden]>
> wrote:
>
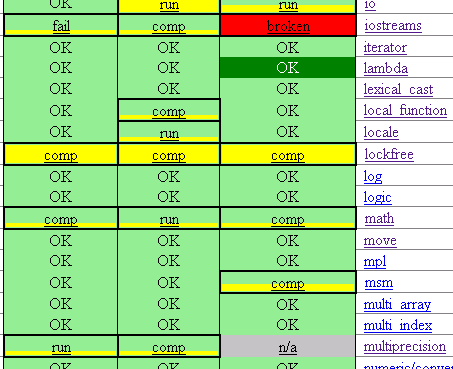
>> So once again, the summary showing graphical percentage of the failing
>> tests per library/toolset could look like this:
>>
>> https://raw.githubusercontent.com/awulkiew/data-images/master/summary-percent-graphical.png
>>
>>
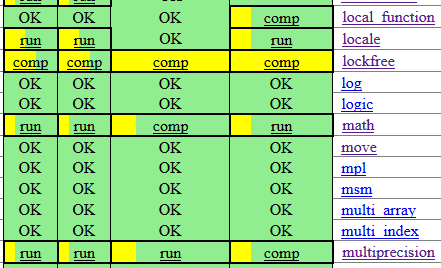
> I like it, one suggestion:
> white background instead of green for the ones with some issue?
I'm glad that you like the overall idea.
Your suggestion could look like this:
https://raw.githubusercontent.com/awulkiew/data-images/master/summary-percent-graphical-w.png
https://raw.githubusercontent.com/awulkiew/data-images/master/summary-percent-graphical-w-b.png
I considered it too but though that since the purpose of this change is
to increase the overall greenness of the matrix according to some
measure, in this case the percent of passed tests, then probably the
green color should be kept. The above pictures are the result of a quick
prototype. E.g. I'd like to allow using various colors for different
failures. The colors would be set using styles so we'd be able to easily
change them.
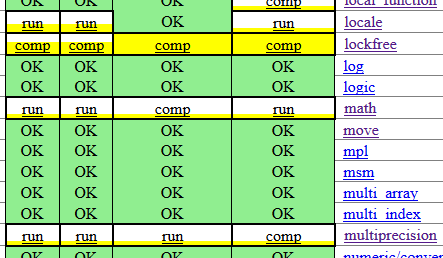
Btw, this is how it could look like if the bar was horizontal:
https://raw.githubusercontent.com/awulkiew/data-images/master/summary-percent-graphical-h.png
As I see it, the vertical bar is more library oriented as it's easier to
compare the tests of a library for different toolsets, because the row
height is the same for all cells of the library. On the other hand the
horizontal bar allows to compare various libraries for a single
toolset/compiler easily, because the width of a column is the same. So
it probably depends on who is watching the summary if he's reading the
cells horizontally or vertically. Does he want to see the level of
portability of some library or how many libraries are reasonably safe to
use on a single platform. I guess the first way would be more useful for
a library developer and the second way for a general user of Boost. So
we could use one kind of display for a developer summary and the other
one for a user summary. The catch is that for now the user summary is
not generated.
Does someone have an entirely different idea?
Regards,
Adam
Boost list run by bdawes at acm.org, gregod at cs.rpi.edu, cpdaniel at pacbell.net, john at johnmaddock.co.uk